Respondent Demographics
Chapter Outline Show
 
Remove Translation Translation
Original Text

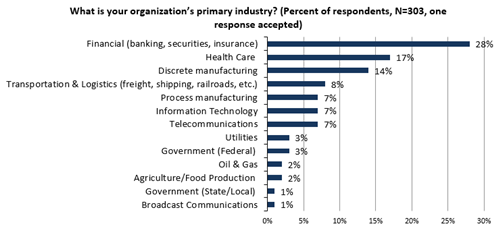
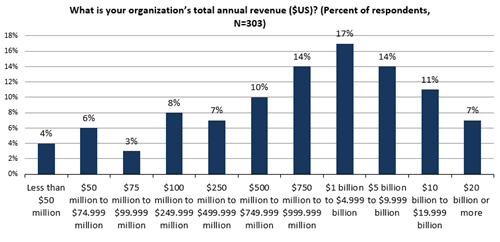
The data presented in this report is based on a survey of 303 qualified respondents. Figures 34-37 detail the demographics of the respondent base, including individual respondents’ current job function, as well as respondent organizations’ total number of employees, primary industry, and annual revenue.

Данные представленные в этом рапорте основаны на обзоре 303 квалифицированных респондентов. Рисунки деталь 34-37 demographics основания респондента, включая индивидуальные респондентов' в настоящее время рабочую функцию, так же, как организации респондента' подытоживают номер работников, профилирующей отрасли, и однолетнего дохода.

Respondents by Current Job Function

Респонденты в настоящее время рабочей функцией

Respondents’ current job functions within their organizations is shown in Figure 34.

Рабочие функции респондентов' в настоящее время в пределах их организаций показаны в рисунке 34.

Figure 34. Survey Respondents by Current Job Function

Respondents by Number of Employees

Респонденты Количеством работников

The number of employees in respondents’ organizations is shown in Figure 35.

Число работников в организации респондентах' показано в рисунке 35.

Figure 35. Survey Respondents by Number of Employees

Respondents by Industry

Респонденты Индустрией

Respondents were asked to identify their organization’s primary industry. All respondent organizations were required to be part of industries categorized by the U.S. Department of Homeland Security (DHS) as Critical Infrastructure and Key Resources (CIKR), as shown in shown in Figure 36.

Были спрошены, что определили респонденты профилирующую отрасль их организации. Необходимы, что была все организации респондента часть индустрий классифицированных США. Отдел обеспеченности Homeland (DHS) как критически инфраструктура и ключевые ресурсы (CIKR), как показано в показано в рисунке 36.

Figure 36. Survey Respondents by Industry

Respondents by Annual Revenue

Респонденты однолетним доходом

Respondent organizations’ annual revenue is shown in Figure 37.

Доход организаций респондента' однолетний показан в рисунке 37.

Figure 37. Survey Respondents by Annual Revenue