Respondent Demographics
Chapter Outline Minimize

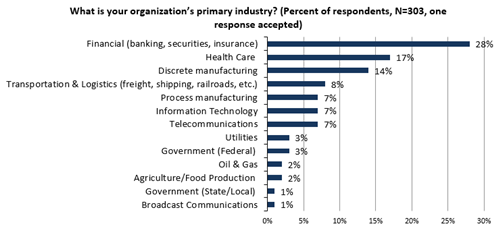
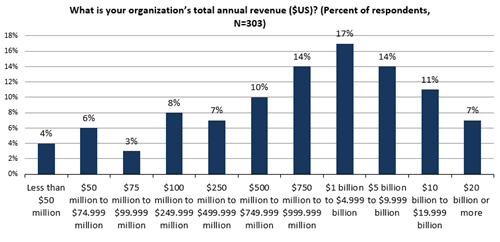
The data presented in this report is based on a survey of 303 qualified respondents. Figures 34-37 detail the demographics of the respondent base, including individual respondents’ current job function, as well as respondent organizations’ total number of employees, primary industry, and annual revenue.

Respondents by Current Job Function

Respondents’ current job functions within their organizations is shown in Figure 34.

Figure 34. Survey Respondents by Current Job Function

Respondents by Number of Employees

The number of employees in respondents’ organizations is shown in Figure 35.

Figure 35. Survey Respondents by Number of Employees

Respondents by Industry

Respondents were asked to identify their organization’s primary industry. All respondent organizations were required to be part of industries categorized by the U.S. Department of Homeland Security (DHS) as Critical Infrastructure and Key Resources (CIKR), as shown in shown in Figure 36.

Figure 36. Survey Respondents by Industry

Respondents by Annual Revenue

Respondent organizations’ annual revenue is shown in Figure 37.

Figure 37. Survey Respondents by Annual Revenue