Respondent Demographics
Chapter Outline Show
 
Remove Translation Translation
Original Text

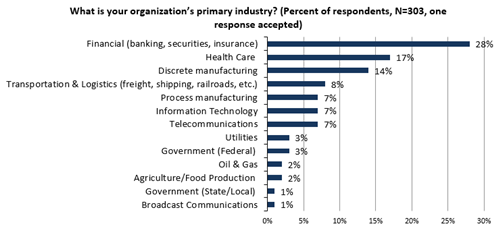
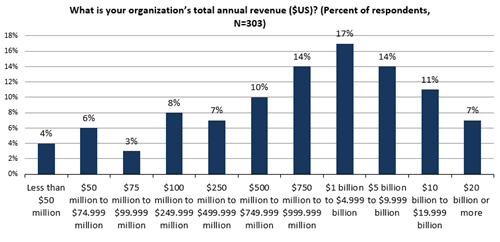
The data presented in this report is based on a survey of 303 qualified respondents. Figures 34-37 detail the demographics of the respondent base, including individual respondents’ current job function, as well as respondent organizations’ total number of employees, primary industry, and annual revenue.

이 보고에서 선물된 자료는 303명의 자격이 된 응답자의 조사에 근거한다. 숫자 34-37 세부사항 직원, 1 차 기업 및 연수익의 개인적인 응답자' 응답자 조직 뿐만 아니라 현재 작업 기능,' 총계를 포함하여 응답자 기초의 인구 통계.

Respondents by Current Job Function

현재 작업 기능에 의하여 응답자

Respondents’ current job functions within their organizations is shown in Figure 34.

응답자' 그들의 조직 내의 현재 작업 기능은 숫자 34에서 보인다.

Figure 34. Survey Respondents by Current Job Function

Respondents by Number of Employees

직원의 Number의 응답자

The number of employees in respondents’ organizations is shown in Figure 35.

응답자에 있는 직원의 수는' 숫자 35에서 조직 보인다.

Figure 35. Survey Respondents by Number of Employees

Respondents by Industry

industry의 응답자

Respondents were asked to identify their organization’s primary industry. All respondent organizations were required to be part of industries categorized by the U.S. Department of Homeland Security (DHS) as Critical Infrastructure and Key Resources (CIKR), as shown in shown in Figure 36.

응답자는 그들의 조직의 1 차 기업을 확인하도록 요청받았다. 모든 응답자 조직은 미국에 의해 분류된 기업의 일부분일 것을 요구되었다. 숫자 36에서 보여주는에서 보이는 긴요한 기반 그리고 중요한 자원 (CIKR)로 국토 안보 (DHS)의 부.

Figure 36. Survey Respondents by Industry

Respondents by Annual Revenue

연수익에 의하여 응답자

Respondent organizations’ annual revenue is shown in Figure 37.

응답자 조직' 연수익은 숫자 37에서 보인다.

Figure 37. Survey Respondents by Annual Revenue