Respondent Demographics
Chapter Outline Show
 
Remove Translation Translation
Original Text

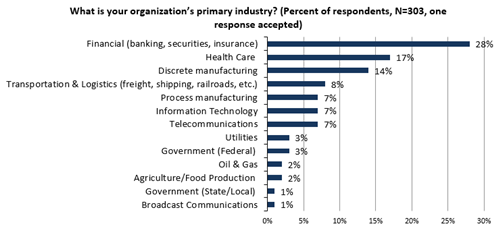
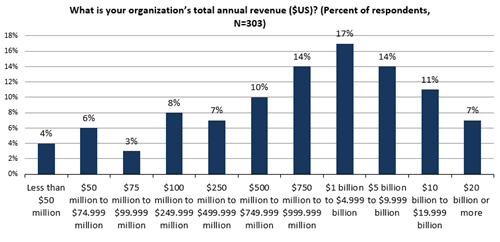
The data presented in this report is based on a survey of 303 qualified respondents. Figures 34-37 detail the demographics of the respondent base, including individual respondents’ current job function, as well as respondent organizations’ total number of employees, primary industry, and annual revenue.

このレポートで示されるデータは303人の修飾された被告の調査に基づいている。 図34-37の細部従業員、第一次企業および年間収入の個々の被告の」被告の組織と同様、現在の職務権限」、の総数を含む被告の基盤の人口統計。

Respondents by Current Job Function

現在の職務権限による被告

Respondents’ current job functions within their organizations is shown in Figure 34.

被告の」組織内の現在の職務権限は図34で示されている。

Figure 34. Survey Respondents by Current Job Function

Respondents by Number of Employees

従業員のNumber著被告

The number of employees in respondents’ organizations is shown in Figure 35.

被告のの従業員の数は」図35で組織示されている。

Figure 35. Survey Respondents by Number of Employees

Respondents by Industry

Industry著被告

Respondents were asked to identify their organization’s primary industry. All respondent organizations were required to be part of industries categorized by the U.S. Department of Homeland Security (DHS) as Critical Infrastructure and Key Resources (CIKR), as shown in shown in Figure 36.

被告は彼らの構成の第一次企業を識別するように頼まれた。 すべての被告の組織は米国によって分類された企業の部分であるように要求された。 図36で示されているに示すように重大な下部組織そして主資源(CIKR)として自国の保安(DHS)の部門。

Figure 36. Survey Respondents by Industry

Respondents by Annual Revenue

年間収入による被告

Respondent organizations’ annual revenue is shown in Figure 37.

被告の組織の」年間収入は図37で示されている。

Figure 37. Survey Respondents by Annual Revenue