|
Dynatrace Live Debugging enables developers to not worry about any of the challenges related to cloning production environments and replicating end-user behavior because they are now able to look directly into the live system without interrupting the application. |
Dynatrace Live Debuggingを使用すると、開発者はアプリケーションを中断することなくライブシステムを直接調べることができるため、本番環境のクローン作成やエンドユーザーの動作の再現に関連する課題について心配する必要がなくなります。 |
|
For example, to diagnose seemingly random latency spikes in the checkout process of a shopping cart, developers can set so-called non-breaking breakpoints at the beginning and at the end of all relevant processes across different microservices. They will then receive a detailed breakdown of how long each step of the overall checkout process took, for all of the different user transactions, in real time. In addition to this breakdown, the live debugger collects potentially relevant transaction parameters, such as the number of items in the cart, the value of those items, the time of day, the geographic location, etc. While developers might spot clear correlations (e.g., the more items in the cart, the worse the latency of that specific transaction), some AI magic is needed for actual root cause analysis. This is simply due to the large number of additional parameters collected for each transaction and the even larger number of permutations of these parameters that could constitute the root cause of the latency issue. |
たとえば、ショッピングカートのチェックアウトプロセスにおける一見ランダムなレイテンシの急上昇を診断するために、開発者はさまざまなマイクロサービスにわたるすべての関連プロセスの最初と最後に、いわゆるノンブレークポイントを設定することができます。その後、さまざまなユーザートランザクションすべてについて、チェックアウトプロセス全体の各ステップにかかった時間の詳細な内訳がリアルタイムで届きます。この内訳に加えて、ライブデバッガーは、カート内のアイテムの数、それらのアイテムの価値、時間帯、地理的位置など、潜在的に関連するトランザクションパラメーターを収集します。開発者は明確な相関関係(たとえば、カート内のアイテムが多いほど、その特定のトランザクションのレイテンシーが悪くなるなど)を見つけるかもしれませんが、実際の根本原因の分析にはAIの魔法が必要です。これは単に、各トランザクションで収集される多数の追加パラメーターと、レイテンシー問題の根本原因となる可能性のあるこれらのパラメーターの並べ替えの数がさらに多いためです。 |

|
The following wide range of factors are possible causes of the latency spikes: |
レイテンシの急上昇には、次のようなさまざまな要因が考えられます。 |
|
Database connection pool metrics: |
データベース接続プールのメトリックス: |
|
Active connections: Number of active database connections at any given time. |
アクティブな接続:特定の時点でのアクティブなデータベース接続の数。 |
|
Idle connections: Number of idle connections waiting to be reused. |
アイドル接続:再利用を待っているアイドル接続の数。 |
|
Connection wait time: Time spent waiting for a connection to become available. |
接続待機時間:接続が使用可能になるまでの待ち時間。 |
|
Network request details: |
ネットワークリクエストの詳細: |
|
Request headers: Errors related to Authorization, Content-Type, etc. |
リクエストヘッダー:認証、コンテンツタイプなどに関連するエラー |
|
Response status codes: Transmission errors. |
応答ステータスコード:送信エラー。 |
|
Response body: Size of content returned by external services. |
レスポンスボディ:外部サービスから返されるコンテンツのサイズ。 |
|
Memory and resource usage: |
メモリとリソースの使用量: |
|
Heap memory usage: Amount of allocated versus used memory. |
ヒープメモリ使用量:割り当てられたメモリと使用されたメモリの量。 |
|
Garbage collection cycles: Frequency of GC cycles are causing. |
ガベージコレクションサイクル:GCサイクルの頻度が原因です。 |
|
Thread pool sizes: Sizing of thread pools for concurrent tasks. |
スレッドプールサイズ:同時実行タスクのスレッドプールのサイズ。 |
|
Cache hit rates: |
キャッシュヒット率: |
|
Cache hits: Number of times cached data is successfully retrieved. |
キャッシュヒット:キャッシュされたデータが正常に取得された回数。 |
|
Cache misses: Number of times data must be fetched from a slower source. |
キャッシュミス:低速のソースからデータを取得する必要がある回数。 |
|
Lock contention: |
ロック競合: |
|
Lock wait time: Time spent waiting for locks to be released. |
ロック待機時間:ロックが解除されるまでの待機時間。 |
|
Lock hold time: Duration locks are held, potentially blocking other threads. |
ロック保持時間:ロックが保持されている間、他のスレッドがブロックされる可能性があります。 |
|
Transaction logs: |
トランザクションログ: |
|
Transactions: Number and requirements of transactions in progress. |
取引:進行中の取引の数と要件。 |
|
Transaction Status: Number of transactions that are committed, rolled back, or pending. |
トランザクションステータス:コミット、ロールバック、または保留中のトランザクションの数。 |
|
Queue Depths: |
キューの深さ: |
|
Message queue length: Number of messages waiting to be processed. |
メッセージキューの長さ:処理待ちのメッセージ数。 |
|
Queue processing time: Time taken to process messages in the queue. |
キュー処理時間:キュー内のメッセージの処理にかかった時間。 |
|
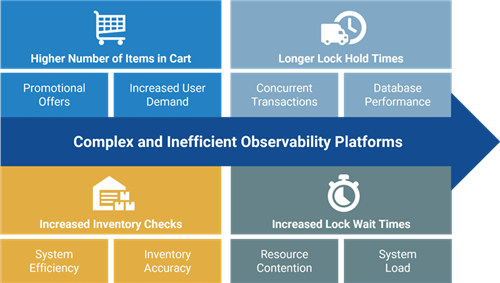
By integrating all telemetry data into Dynatrace, powered by its Davis AI engine, which combines causal AI, predictive AI, and generative AI, Dynatrace can automatically identify the root cause of issues without requiring user input or a background in data science. For instance, an unexpected surge in active database connections might result in longer connection wait times, ultimately causing latency in inventory checks. Davis AI can automatically pinpoint the root cause of such latency spikes by analyzing temporal dependencies and contextual information within the time-series data. Based on these insights, the relationships could look like this: |
因果AI、予測AI、ジェネレーティブAIを組み合わせたDavis AIエンジンを搭載したすべてのテレメトリデータをDynatraceに統合することで、Dynatraceはユーザーの入力やデータサイエンスのバックグラウンドを必要とせずに、問題の根本原因を自動的に特定できます。たとえば、アクティブなデータベース接続が予期せず急増すると、接続の待ち時間が長くなり、最終的にはインベントリチェックに遅延が生じる可能性があります。Davis AI は、時系列データ内の時間的依存関係とコンテキスト情報を分析することで、このようなレイテンシの急上昇の根本原因を自動的に特定できます。これらのインサイトに基づくと、関係は次のようになります。 |

|
Now, causal AI and generative AI can collaborate to make recommendations for resolving the issue. Ultimately, the observability platform could automatically implement predictive or incident remediation steps with Dynatrace AutomationEngine, including verification of resolutions. Developers may then choose to continue the data collection, at least for edge cases, to receive early warnings in case the problem returns. |
これで、因果的AIとジェネレーティブAIが協力して、問題を解決するための推奨事項を作成できるようになりました。最終的に、オブザーバビリティ・プラットフォームは、Dynatrace AutomationEngineを使用して、解決策の検証を含む予測またはインシデント修復ステップを自動的に実装できるようになりました。開発者は、問題が再発した場合に早期に警告を受けるために、少なくともエッジケースについてはデータ収集を継続することを選択できます。 |