Dynatrace Live Debugging enables developers to not worry about any of the challenges related to cloning production environments and replicating end-user behavior because they are now able to look directly into the live system without interrupting the application.
For example, to diagnose seemingly random latency spikes in the checkout process of a shopping cart, developers can set so-called non-breaking breakpoints at the beginning and at the end of all relevant processes across different microservices. They will then receive a detailed breakdown of how long each step of the overall checkout process took, for all of the different user transactions, in real time. In addition to this breakdown, the live debugger collects potentially relevant transaction parameters, such as the number of items in the cart, the value of those items, the time of day, the geographic location, etc. While developers might spot clear correlations (e.g., the more items in the cart, the worse the latency of that specific transaction), some AI magic is needed for actual root cause analysis. This is simply due to the large number of additional parameters collected for each transaction and the even larger number of permutations of these parameters that could constitute the root cause of the latency issue.

The following wide range of factors are possible causes of the latency spikes:
Database connection pool metrics:
Active connections: Number of active database connections at any given time.
Idle connections: Number of idle connections waiting to be reused.
Connection wait time: Time spent waiting for a connection to become available.
Network request details:
Request headers: Errors related to Authorization, Content-Type, etc.
Response status codes: Transmission errors.
Response body: Size of content returned by external services.
Memory and resource usage:
Heap memory usage: Amount of allocated versus used memory.
Garbage collection cycles: Frequency of GC cycles are causing.
Thread pool sizes: Sizing of thread pools for concurrent tasks.
Cache hit rates:
Cache hits: Number of times cached data is successfully retrieved.
Cache misses: Number of times data must be fetched from a slower source.
Lock contention:
Lock wait time: Time spent waiting for locks to be released.
Lock hold time: Duration locks are held, potentially blocking other threads.
Transaction logs:
Transactions: Number and requirements of transactions in progress.
Transaction Status: Number of transactions that are committed, rolled back, or pending.
Queue Depths:
Message queue length: Number of messages waiting to be processed.
Queue processing time: Time taken to process messages in the queue.
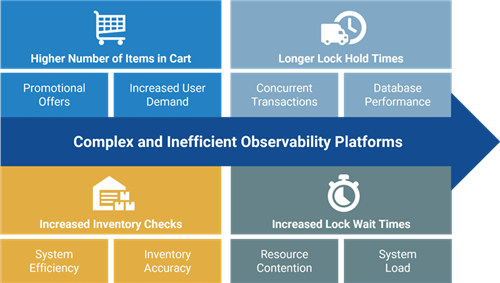
By integrating all telemetry data into Dynatrace, powered by its Davis AI engine, which combines causal AI, predictive AI, and generative AI, Dynatrace can automatically identify the root cause of issues without requiring user input or a background in data science. For instance, an unexpected surge in active database connections might result in longer connection wait times, ultimately causing latency in inventory checks. Davis AI can automatically pinpoint the root cause of such latency spikes by analyzing temporal dependencies and contextual information within the time-series data. Based on these insights, the relationships could look like this:

Now, causal AI and generative AI can collaborate to make recommendations for resolving the issue. Ultimately, the observability platform could automatically implement predictive or incident remediation steps with Dynatrace AutomationEngine, including verification of resolutions. Developers may then choose to continue the data collection, at least for edge cases, to receive early warnings in case the problem returns.